Data Visualization
Publish date: Mar 6, 2020
Last updated: Apr 22, 2020
Last updated: Apr 22, 2020
IMAGE GALLERY (14)
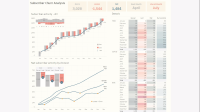
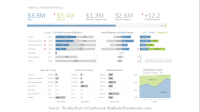
Book of Dashboards
- Steal like an Artist
- DIfference b/w plaigraism and taking isnpiration
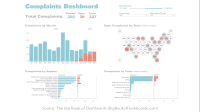
- Each graph should answer a business question
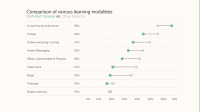
- Use graphs wisely for particular data representation, each graph has its pros and cons
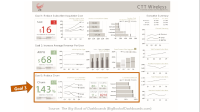
- Sequential Color - Highlights (Use 3 max)
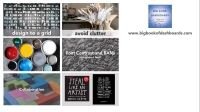
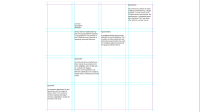
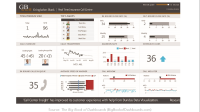
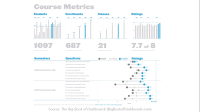
- Design to grids, and use contrast to navigate eye - Bigger, medium and smaller objects
- Layout designs
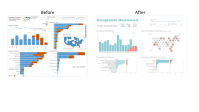
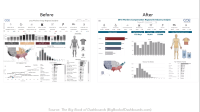
- Decultter - remove labels borders, highlight parts only you are intertested
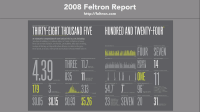
- 3 level Font scheme - Use big bad ass numbers / Summary bands on TOP (eye-tracking research)
Steal Like an Artist
An Artist is a Collecter. Selective collection Creative Kleptomaniac
$$ { 1 + 1 = 3 } $$


