Gantt Chart
Publish date: Jul 6, 2019
Last updated: Aug 17, 2019
Last updated: Aug 17, 2019
IMAGE GALLERY (5)
Charts are an opportunity, a story telling tool, a chance to make convincing argument through visualizing data
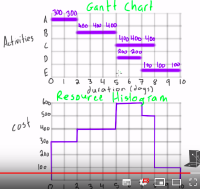
Scheduling of tasks and displaying visual progress. Displays dependency relationship and schedule status
- Effective communication tool
- East to see and understand
- Considers tasks parallelism
- Add daily cost and cumulative costs to task planning
- Don’t clearly show the relationships between tasks
- Doesnt clearly the show impact of a task is delayed
- Gantt charts are sometimes complimentated with resource histogram1
- Fully function excel gantt chart with completed status
- FS (Finish to Start)
- A task that cannot start before the completion of its preceding task
- SS (Start to Start)
- A Task that cannot start until its predecessor starts. Usually these will start together, however the dependent task may start later.
- FF (Finish to Finish)
- A task that is scheduled to finish at the same time as the preceding task.
- PDM - Precedence diagram Method
- is a tool for scheduling activities in a project plan
- great to highlight dependencies
| Early Start | Activiity | Early Finish |
|---|---|---|
| Late Start | #Days | Late Finish |
Forward project pass and backward project pass
- CPM - Critical Path Method
- where Early/late start/finish are same
- if any activity schedule changes, entire project duration will change
Network diagrams
- PDN - Precedence Diagram Method
- CPM - Critical Path Method
[bibliography]


